“When a hospital trades in an Xi for a DV5, the same program slot gives 11% more procedures a quarter.”
The Xi-to-DV5 replacement cycle is a growth avenue for five more years, on 85% recurring revenue, with no debt.
The decision, step by step
-
1Entry · 30 Mar 2026
Started legging in
While researching the medtech sector.
-
22 Sep 2026
Q2 FY2026 notes completed
The replacement cycle carries the growth, and the balance sheet is pure optionality:
- 85% recurring revenue; no debt; cash is 25% of total assets
- Trade-ins up from 67 in Q1’25 to 144 in Q2’26
- An Xi traded in for a DV5 gives the same program slot 11% more procedures a quarter
- Open question: pricing (EUP), on the Q3 call
-
3Now · registered 20 Oct 2026
Three tests that would put the thesis under review
- I&A revenue per procedure down more than 5% year on year without faster procedure growth, for two quarters (from 2027 through Q4 2028)
- Fewer than 100 trade-ins a quarter for two quarters, before the end of 2028
- US procedures per system flat or down year on year for two quarters, through Q4 2027
Starting points, Q2’26: about $1,830 of I&A per da Vinci procedure; 144 trade-ins; US utilization +3%. First reading with the Q3 2026 results.
-
4Q3 2026 call
EUP, and the four readings
What management says about EUP pricing, and the four readings I take every quarter: I&A revenue per procedure, trade-ins, US system utilization growth and usage-based lease revenue growth.
-
5H2 2027
Benign procedures expected to accelerate
The test of the EUP bet: whether volume elasticity shows up in lower-acuity procedures while I&A per procedure is stable or falling.
The note
i filing · ii management · iii third party · H my calculation · quotes from my call notes
The quarter: P&L, balance sheet, valuation
| Revenue by type | Q2’26, $m | YoY | Share |
|---|---|---|---|
| Instruments and accessories (I&A) | 1,735 | +18% | 60% |
| Systems | 685 | +19% | 24% |
| Services | 472 | +21% | 16% |
| Total | 2,892 | +19% | 100% |
Recurring revenue is $2.47b, 85% of the total. ii Product revenue (I&A and systems) is 84% of the total and grew 18.1% in the quarter; services are 16% and grew 20.8%. H
| Q2’26 | H1’26 | Q2’25 | H1’25 | |
|---|---|---|---|---|
| Gross margin | 68% | 67% | 66.3% | 65.5% |
| Operating margin | 33.6% | 32% | 30.5% | 28.2% |
| Cash from operations ex SBC and working capital / revenue | — | 38.3% | — | 34.6% |
- No debt, and cash is 25% of total assets: pure optionality. H
- Goodwill is 2.8% of total assets: an organic compounder. H
- Shares: 352.3m in ’24, 356.6m in ’25, 355.1m in ’26. i
- At $380, the normalized P/E on Q2’26 is 41.6×. H
- The free cash flow yield is 3.2% at $380. Net of cash (380 less 25% = $285), it is 4.2%. H
Growth by line and geography
| YoY growth | Q2’26 | Q1’26 | FY’25 | Q3’25 | Q2’25 | Q1’25 |
|---|---|---|---|---|---|---|
| I&A revenue | +17.7% | +23.3% | +18.5% | +20.1% | +18.5% | +18% |
| Systems | +19.2% | +24.5% | +25.8% | +32.7% | +28.2% | +58% |
| Services | +20.8% | +19.5% | +20.2% | +20.4% | +23.3% | +17% |
| I&A revenue, US (68% of I&A revenue) | +16.0% | +16.4% | +15.9% | +17.4% | +14.1% | +17.2% |
| I&A revenue, outside the US (19.2% of total revenue) | +21.4% | +39.8% | +25% | +27% | +29.4% | +20% |
59.2% of the business, systems and services (about 40%) plus I&A outside the US (19.2%), is growing at about 20% year on year, while I&A in the US is growing at about 16%. H
Net income attributable to the China joint venture (noncontrolling interest): $5.1m in Q2’26, $4.5m in Q1’26 and $20.6m in FY’25, after $14.9m in ’24 and $19.3m in ’23. i
Placements, platforms, installed base
Q2 placements: 468. That is 246 DV5, 38 SP, 64 Xi R, 58 X and 62 Xi; 114 of them with a dual console, which generates a moat: training capacity. ii US placements went from 216 in Q2’25 to 267 in Q2’26: 27 greenfield systems at ambulatory surgery centers (ASCs); otherwise, almost entirely upgrades to DV5.
| Platform | Generation | Year | Note | Placed in Q2’26 | Installed |
|---|---|---|---|---|---|
| da Vinci Xi | 4th | 2014 | Core installed base; flagship multiport; legacy | 62 | |
| da Vinci X | 4th | 2017 | De-featured, so affordable | 58 (49 a year ago) | |
| da Vinci Xi R | 4th | 2025 | Refurbished Xi | 64 (10 a year ago) | 130 |
| da Vinci SP | 4th | 2018 | 38 | 445 | |
| da Vinci 5 | 5th | 2024 | Force feedback; 10,000× the compute | 246 | 1,700 |
| Ion | Own architecture | 2019 | Lung biopsy, not surgery | 55 (+21%) | 1,096 |
- Higher utilization of DV5 than of Xi. ii
- System utilization is the metric in the US: it grew 3% in Q2, a “healthy level”. ii
- Management: “distributor markets have responded well”. That is, Intuitive acquired its European distributor, apparently to take the distributor’s share, as those businesses had been responding well. ii
The replacement cycle and trade-ins
From Si to Xi took seven years, with peak trade-ins in 2024. From Xi to DV5, 2024 to around 2031: a growth avenue for five more years.
DV5 placements: 352 in ’24, 870 in ’25, 230 in Q1’26 and 246 in Q2’26. That is 1.7K of an 11.7K fleet (14.5%); with 445 SP, DV5 and SP together are 18.3%. The rest, 11.7K less DV5 and SP, is about 9,565 fourth-generation and older systems; ASCs and hospital outpatient departments may stay on the fourth generation. H
| Q2’26 | Q1’26 | Q4’25 | Q3’25 | Q2’25 | Q1’25 | |
|---|---|---|---|---|---|---|
| Trade-ins | 144 | 119 | 146 | 141 | 83 | 67 |
Trade-in velocity is accelerating, for three reasons: the DV5 ASP credit; Xi R, refurbishing traded-in systems for resale to ASCs; and the utilization uplift.
Xi R started a year ago: 130 sold, 50 in the US, 20 at ASCs, in 11 to 12 countries. ii A fourth-generation ecosystem, affordable, gives access to customers not yet in robotics, and then, perhaps, upside.
When a hospital trades in an Xi for a DV5, the same program slot gives 11% more procedures a quarter: growth even with the base stalled.
Why? Management says it is because of what the systems are. I want to check whether it is also where they sit, and whether the +11% holds once the flagship accounts have already upgraded.
The capex cycle
The investor concern: bad debt might build at hospitals as people fall off ACA and Medicaid coverage. The response: US system placements were healthy in Q2, up 24% year on year, and about 70% were acquired under leasing arrangements, which gives hospitals more flexibility under capital constraints. ii
Hospitals typically buy systems ahead of rising demand. That is not the case now: they are not expanding the installed base.
Leasing mix and revenue quality
Operating leases as a share of all placements: 48% in 2023, 51% in 2024, 49% in 2025 and 54% in Q2’26, a very recent uptick. Of these, 57% are usage-based leases, paid as procedures are performed: less predictability, but more skin in the game and more upside as more indications are cleared. Not just an annuity. ii
Usage-based is not the fastest-growing lease type: fixed-payment operating leases grew 55% in H1 year on year, against 7.8% for usage-based. Sales-type leases: 23 in H1’26, against 16 in H1’25. i
Since 2025, property, plant and equipment includes the systems leased to customers, to support the leasing business: previously in operating activities, now in investing activities. i
Pricing: the EUP thread
To watch in the coming quarters, in 2027: whether EUP, the Extended Use Program, starts to push I&A revenue per procedure down.
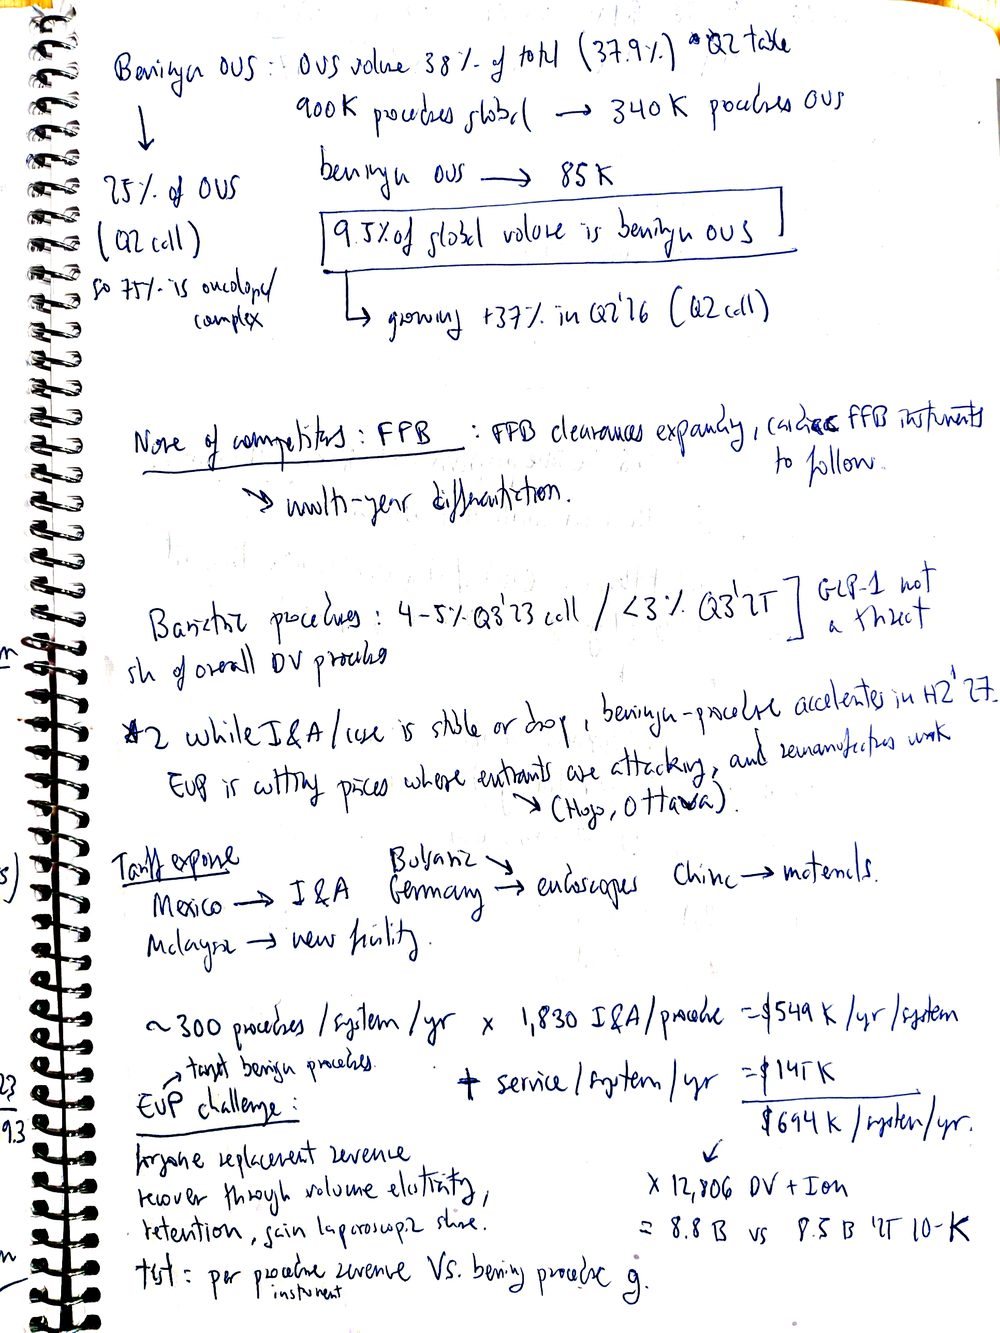
If, through EUP, Intuitive gets incremental volume in lower-acuity procedures, spending there the pricing gains from premium procedures such as force feedback (FFB), DV5 and SP, the strategy can work if volume elasticity really shows up. So we may see a scenario where I&A revenue per case is stable or falling while benign procedures accelerate in H2’27. Here Intuitive is cutting prices where entrants such as Hugo and Ottava are going to attack, and where remanufacturers are trying to enter with their refurbished instruments.
The EUP challenge: forgone replacement revenue, recovered through volume elasticity, retention and laparoscopic share gains. The test: revenue per procedure against benign-procedure growth.
I&A revenue per procedure: $2,200 for Ion (Q3 and Q4 ’25 calls), $1,830 for da Vinci (Q2’26). ii Management lists Ion and DV5 growth as offsets to product cost reduction.
| Revenue per system, a year | |
|---|---|
| About 300 procedures × $1,830 of I&A per procedure | $549K |
| Service per system | $145K |
| Revenue per system | $694K |
| × 12,806 da Vinci and Ion systems | $8.9b |
| Against the ’25 10-K | $8.5b |
Benign procedures, seasonality, outside the US
Procedures outside the US are 38% of the total (37.9%): 340K of 900K globally. Benign procedures are 25% of those (Q2 call), about 85K, so 75% is complex oncology. Benign procedures outside the US are 9.5% of global volume, and they grew 37% in Q2’26 (Q2 call). ii
System placements are seasonal: up in Q4, down in Q1. More than 50% of da Vinci procedures are benign, and benign procedures are more seasonal than cancer or other life-threatening ones: up in Q4, down in Q1.
Competition, antitrust, remanufacturing
- Antitrust: no antitrust injunction can override FDA clearance for third parties.
- Restore Robotics: on March 31, ’26, clearance to remanufacture two more Xi instruments, after a March ’25 clearance for Restore scissors. Restore’s clearances cover 4 I&A out of more than 100 EndoWrist SKUs (made obsolete by the platform transition), all on Xi, while Intuitive’s growth comes from DV5 and SP. iii
- The clearance process costs $100K–$250K and takes 6 to 7 months per SKU. iii
- Intuitive still hasn’t followed the printer pathway (managed print services) or the aviation one (parts manufacturer approval), which bundle service and asset into one toll. Intuitive’s is only a system lease, with I&A apart.
- None of the competitors has force feedback. FFB clearances are expanding, with cardiac FFB instruments to follow: multi-year differentiation.
- Bariatric procedures were 4–5% of da Vinci procedures (Q3’23 call) and are below 3% (Q3’25 call): GLP-1 is not a threat. ii
Tariff exposure
| Country | Exposure |
|---|---|
| Mexico | I&A |
| Germany, Bulgaria | Endoscopes |
| China | Materials |
| Malaysia | New facility |
What I watch
- The four readings, every quarter: I&A revenue per procedure, trade-ins per quarter, US system utilization growth, usage-based lease revenue growth.
- EUP: what management says on the Q3 call, and in 2027 whether it starts to push I&A revenue per procedure down.
- Whether the +11% holds once the flagship accounts have upgraded.
- Early signs of M&A: Intuitive tends to buy IP early and cheap, then spends R&D on it internally.
- Still tracking: the new GI treatment robot (early stage, not commercial); product mix across Xi, SP, DV5, Xi R and Ion; Ion and DV5 growth as offsets to product cost reduction.
- The three tests that would put the thesis under review (step 3).
Position on the day of publication: held. I don’t trade against a published view in the 72 hours after publishing it, except to carry out a pre-stated exit or risk limit. Not investment advice.