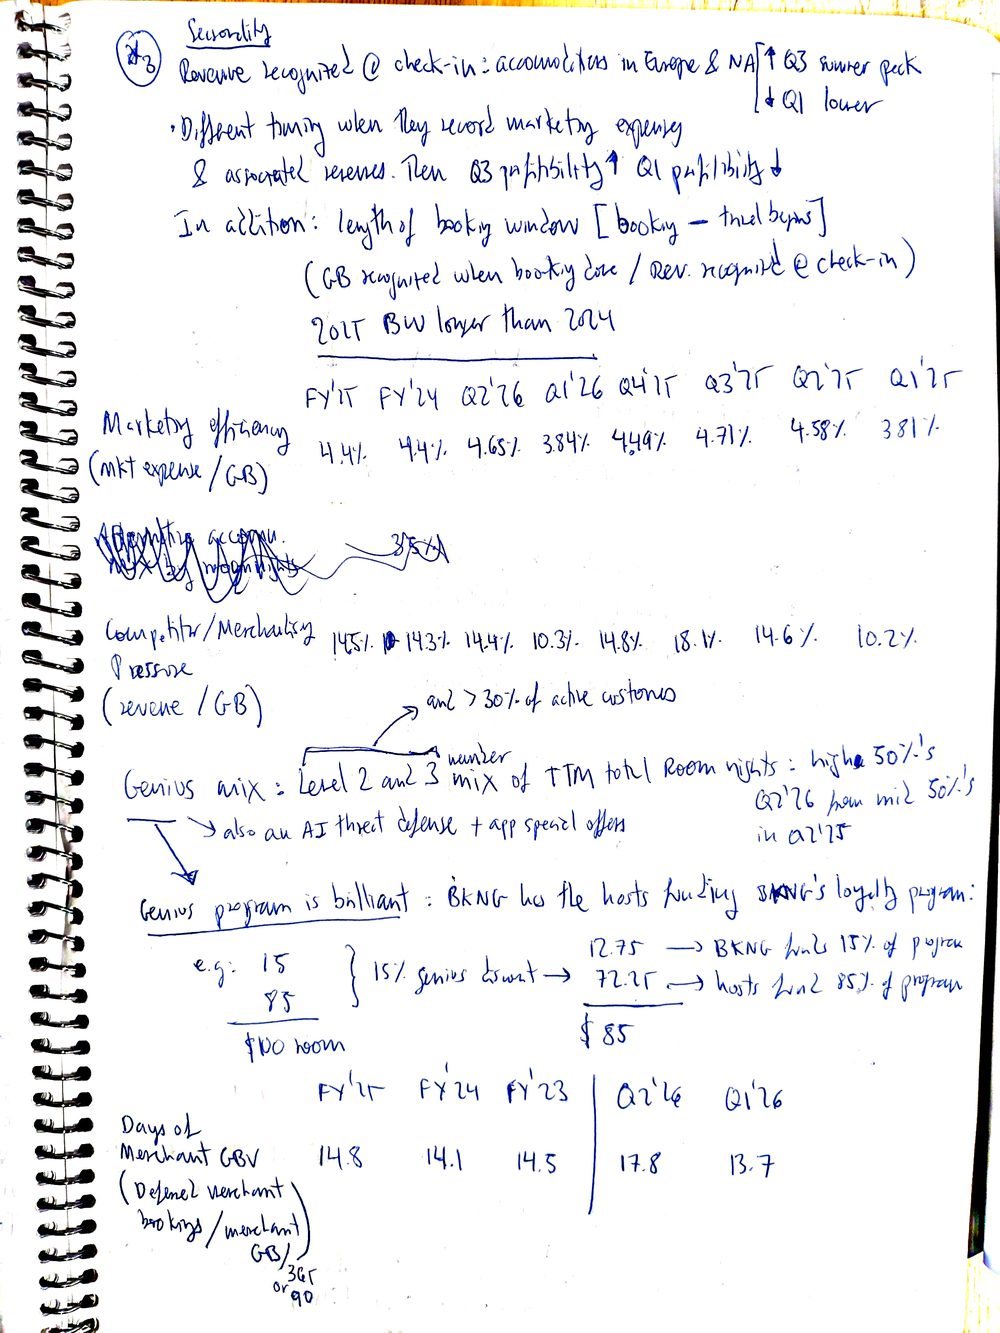
“The Genius program is brilliant: Booking has the hosts funding its loyalty program.”
Careful with the long-term ambition: the 15% EPS growth is a buyback promise, not an operating promise.
The decision, step by step
-
1Entry · 7 Jul 2026
Started legging in
-
221 Sep 2026
Working notes completed
Valuation, the merchant model, Genius, B2B and AI:
- 21× trailing earnings at $190; 18.3× forward on the 15% EPS ambition
- Merchant mix rising, the machinery of the Connected Trip
- An aggressive buyback: shares down 5.6% since the end of ’25
- AI: LLM traffic is under 1% of the total so far
-
3Now · registered 20 Oct 2026
Three tests that would put the thesis under review
- Variable contribution rate below 7.30% on a trailing twelve-month basis, or adjusted CFO below 85% of operating income
- App share of room nights down from high 50s to mid 50s, or B2C direct mix down from mid 60s to low 60s
- Genius levels 2 and 3, as a share of TTM room nights, dropping from the high 50s
Starting points, Q2’26: variable contribution 7.44% TTM, and −11 bp against a year earlier in the quarter, the lead indicator; app share high 50s; B2C direct mix mid 60s; Genius levels 2 and 3 high 50s. First reading with the Q3 2026 results.
-
4Q3 2026 results
Guidance below expectations
Room nights +3–5%; gross bookings, revenue and EBITDA +4–6%, held back by lower flight-ticket growth.
-
5January 2027
The B2B unit starts formally
Whether Booking starts to disclose B2B, and at what take rate.
The note
i filing · ii management · iii third party · H my calculation · quotes from my call notes
Valuation and the long-term ambition
Trailing twelve-month earnings per share are 9.04. At $190, that is a TTM P/E of 21×, roughly the market multiple. Applying the 15% adjusted-EPS ambition, 9.04 × 1.15 = 10.40, which at $190 is an 18.3× forward P/E. H
The long-term ambition: 8% growth in gross bookings, 8% in revenue and 15% in adjusted EPS. ii Careful: the 15% is a buyback promise, not an operating promise. The gap between 8% revenue growth and 15% EPS growth is share count, not operations.
What goes into adjusted EPS: net income, plus impairments, amortization of intangibles, “adjustments related to transformation costs”, the change in equity securities, and currency transaction gains and losses on the remeasurement of the euro debt. i The transformation-cost add-back has appeared in every quarter since Q4’24, always adding. At what point is a recurring cost an operating cost?
Revenue mix and guidance
| Share of total revenue | Q2’26 | Q1’26 | Q4’25 | Q3’25 | Q2’25 | FY’19 |
|---|---|---|---|---|---|---|
| Merchant | 69.7% | 66.8% | 66.9% | 68.1% | 65.5% | 25.4% |
| Agency | 25.9% | 27.6% | 28.2% | 28.5% | 30% | 67.2% |
| Advertising | 4.4% | 5.5% | 4.8% | 3.4% | 4.4% | 7.4% |
Guidance for Q3: room nights up 3–5%; gross bookings, revenue and EBITDA up 4–6%. Lower than expected, because of lower flight-ticket growth. ii
The Connected Trip and the verticals
Connected Trip transactions are those where the traveler books more than one vertical. They are a low-double-digit percentage of total transactions and, per management, growing faster than overall transactions. ii
| Connected Trip | Q2’26 | Q1’26 | Q4’25 | Q3’25 | Q2’25 | Q1’25 |
|---|---|---|---|---|---|---|
| Transactions, YoY growth | low double digits | high teens | high 20s | mid 20s | 30% | 35% |
| Share of total transactions | low double digits | low double digits | low double digits | low double digits | low double digits | high single digits |
Rapidly maturing growth, and a stable share: the Connected Trip cannot outgrow the general growth rate.
| YoY growth | FY’25 | Q2’26 | Q1’26 | Q4’25 | Q3’25 | Q2’25 |
|---|---|---|---|---|---|---|
| Room nights | 8% | |||||
| Rental car days | 5.8% | −6.5% | −4.9% | 2.1% | 9% | 7.7% |
| Airline tickets | 36.6% | 3.7% | 28.5% | 32.3% | 44.2% | 44.8% |
| Merchant gross bookings | 24.8% | 14.5% | 24.3% | 26% | 25.1% | 21% |
| Agency gross bookings | −8.7% | −3.3% | −3.1% | −7.6% | −7.5% | −12.8% |
| Total gross bookings | 12.4% | 9% | 15.2% | 14.3% | 12.8% | 7.2% |
Airline tickets are growing mainly on price, not volume, and from a small base.
Rental car is highly elastic. The Q2’26 and Q1’26 declines: a partner channel issue? Maybe travelers economizing because of the Iran war. Or just high rental prices: the 2023–24 growth was attributed to lower rental prices.
The merchant model is the Connected Trip machinery
Merchant is trending up on a shift in policy: offering flexible transaction terms (payment forms, currencies, timing). Expenses rise with it (personnel, card and bank fees, chargebacks from fraud), recorded in “personnel” and “sales and other expenses”. In theory this hurts margins, but in ’25 the incremental revenue from facilitating payments exceeded the associated incremental variable expenses. Other revenue rises too: payment card rebates, recorded in merchant revenue. i
Management: “We continue to expand merchant (…) to a) provide more payment options, b) increase the variety of our accommodations and c) enable our long-term Connected Trip strategy.”
A polite description of merchant for alternative accommodation: it keeps the host from taking the guest off the platform.
The merchant uptrend should improve cash conversion, as Booking doesn’t have to collect from the hotel. Alternative accommodation favors the merchant model, and flights are structurally merchant. The uptrend signals that the Connected Trip strategy is working.
The wonderful side effect: deferred merchant revenue
Merchant builds a growing pool of deferred merchant revenue, on which Booking earns short-term interest. The balance builds in Q1–Q2 as summer loads, and drains in Q3–Q4 as stays occur and partners get paid. The trend is toward a smaller effect.
| Deferred merchant revenue effect | $m |
|---|---|
| FY’25 | 796 |
| FY’24 | 1,361 |
| FY’23 | 2,742 |
| FY’22 | 3,718 |
| Days of merchant gross bookings | Days |
|---|---|
| FY’25 | 14.8 |
| FY’24 | 14.1 |
| FY’23 | 14.5 |
| Q2’26 | 17.8 |
| Q1’26 | 13.7 |
Genius: the hosts fund the loyalty program
| Genius levels 2 and 3, share of TTM room nights | Q2’26 | Q1’26 | Q4’25 | Q3’25 | Q2’25 | Q1’25 |
|---|---|---|---|---|---|---|
| Share | high 50s | high 50s | high 50s | mid 50s | mid 50s | mid 50s |
Levels 2 and 3 went from the mid 50s to the high 50s of TTM room nights between Q2’25 and Q2’26, and they are more than 30% of active customers. ii Genius is also a defense against the AI threat, together with special offers in the app.
The Genius program is brilliant: Booking has the hosts funding its loyalty program.
| A $100 room | Price | Booking | Host |
|---|---|---|---|
| Without Genius | $100 | $15 | $85 |
| With the 15% Genius discount | $85 | $12.75 | $72.25 |
Booking funds 15% of the program, and the hosts fund 85%.
The CEO: “Genius cannot be 100%; it must be a balance, so the partner gets value. It must be incremental: it fills the empty room, and that goes directly to the bottom line.”
How management talks about it
The CEO: “There were always many ways to discover and explore travel, including social media now, and AI… Then, can they go directly to the supplier, the hotel? If only it were so simple… it is a little harder than that.” That is the Connected Trip’s attacking move.
The CEO: “There was never a shortage of ways to make a booking; it is a question of trust.” And: “60% comes to us directly in B2C.” The answer is better service.
The CEO: “Traveling is like dominoes: one thing fails, and everything falls apart.” He uses it to argue that an LLM planning and shopping is not viable without someone behind it. The consumer’s past history is data the Connected Trip can use to personalize the experience.
Take rates and revenue growth
| $m | FY’25 | FY’24 | Q2’26 | Q1’26 | Q4’25 | Q3’25 | Q2’25 | Q1’25 |
|---|---|---|---|---|---|---|---|---|
| Merchant gross bookings | 130,025 | 104,182 | 36,996 | 38,736 | 30,813 | 35,737 | 32,305 | 31,170 |
| Merchant revenue | 17,755 | 14,142 | 5,127 | 3,698 | 4,249 | 6,131 | 4,457 | 2,918 |
| Agency gross bookings | 56,082 | 61,378 | 13,961 | 15,012 | 12,218 | 13,932 | 14,432 | 15,500 |
| Agency revenue | 7,968 | 8,524 | 1,903 | 1,528 | 1,791 | 2,569 | 2,044 | 1,564 |
| Merchant take rate | 13.66% | 13.57% | 13.85% | 9.55% | 13.79% | 17.2% | 13.8% | 9.36% |
| Agency take rate | 14.21% | 13.88% | 13.63% | 10.2% | 14.7% | 18.4% | 14.2% | 10.1% |
Why is the take rate lower in merchant? The innovator’s dilemma prescription: it is not a margin loss, it is a change in mix. Merchant may include all the low-take-rate business outside accommodation (flights), which drags the average down. And merchandising is netted against merchant revenue only.
| YoY growth | FY’25 | Q2’26 | Q1’26 | Q4’25 | Q3’25 | Q2’25 | Q1’25 |
|---|---|---|---|---|---|---|---|
| Merchant revenue | 25.5% | 15% | 26.7% | 27.4% | 23.3% | 29.3% | 22.2% |
| Agency revenue | −6.52% | −6.9% | −2.3% | −3.9% | −6.7% | −4.7% | −11.3% |
| Total revenue ex advertising | 13.5% | 8.1% | 16.6% | 16.2% | 12.6% | 16.3% | 8% |
| Advertising revenue | 11.3% | 8.4% | 9.3% | 14% | 14.5% | 10.4% | 6.1% |
| Total revenue | 13.4% | 8.1% | 16.2% | 16% | 12.7% | 16% | 7.9% |
Advertising revenue is the most at risk from AI agents that navigate rather than search. Gross bookings are much more affected by lower flight-ticket growth than revenue or EBITDA, which confirms the low take rate of flights.
Variable contribution
Gross bookings: Genius discounts show up mainly here, and an eventual price war would too (a lower average daily rate); if Booking funded it, then in a lower take rate.
Variable contribution, TTM
=take ratepayment revenues
−marketing ÷ gross bookingstoll
−sales and other ÷ gross bookingspayment processing cost
Changes in the trailing rate:
- Q2’26, −3 bp: a real drop; cancellations affected Q2 revenues.
- Q1’26, −9 bp: timing; in Q1 bookings go up while revenue is not yet recognized, so the drop is mechanical.
- Q4’25, −3 bp: marketing investments.
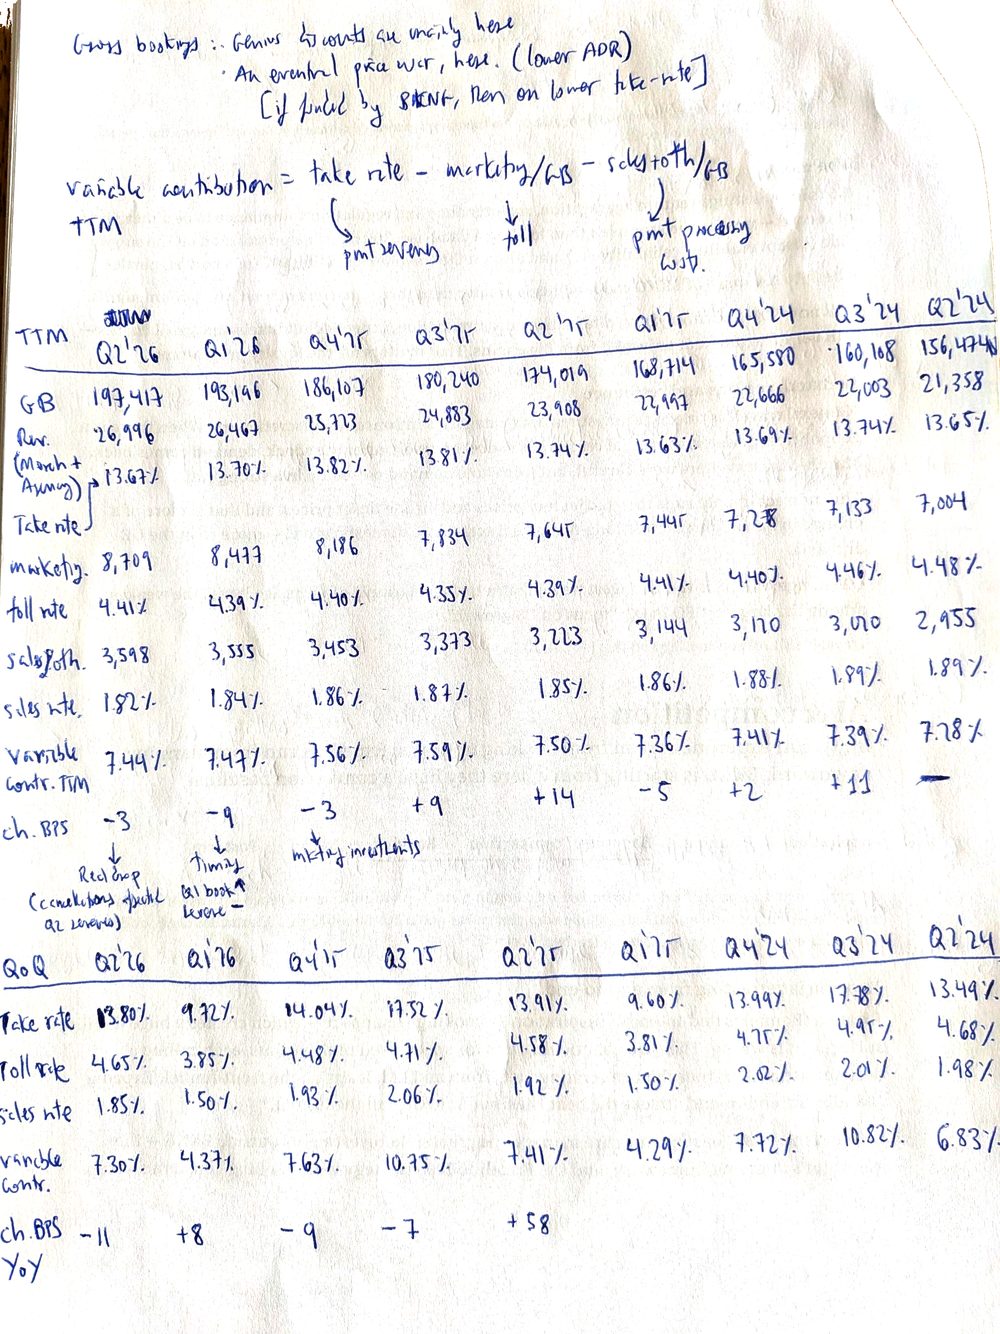
| TTM, $m | Q2’26 | Q1’26 | Q4’25 | Q3’25 | Q2’25 | Q1’25 | Q4’24 | Q3’24 | Q2’24 |
|---|---|---|---|---|---|---|---|---|---|
| Gross bookings | 197,417 | 193,196 | 186,107 | 180,240 | 174,019 | 168,714 | 165,580 | 160,108 | 156,474 |
| Revenue, merchant + agency | 26,996 | 26,467 | 25,723 | 24,883 | 23,908 | 22,997 | 22,666 | 22,003 | 21,358 |
| Take rate | 13.67% | 13.70% | 13.82% | 13.81% | 13.74% | 13.63% | 13.69% | 13.74% | 13.65% |
| Marketing | 8,709 | 8,477 | 8,186 | 7,834 | 7,645 | 7,445 | 7,278 | 7,133 | 7,004 |
| Toll rate | 4.41% | 4.39% | 4.40% | 4.35% | 4.39% | 4.41% | 4.40% | 4.46% | 4.48% |
| Sales and other | 3,598 | 3,555 | 3,453 | 3,373 | 3,223 | 3,144 | 3,120 | 3,020 | 2,955 |
| Sales rate | 1.82% | 1.84% | 1.86% | 1.87% | 1.85% | 1.86% | 1.88% | 1.89% | 1.89% |
| Variable contribution | 7.44% | 7.47% | 7.56% | 7.59% | 7.50% | 7.36% | 7.41% | 7.39% | 7.28% |
| Change, bp | −3 | −9 | −3 | +9 | +14 | −5 | +2 | +11 | — |
| Each quarter | Q2’26 | Q1’26 | Q4’25 | Q3’25 | Q2’25 | Q1’25 | Q4’24 | Q3’24 | Q2’24 |
|---|---|---|---|---|---|---|---|---|---|
| Take rate | 13.80% | 9.72% | 14.04% | 17.52% | 13.91% | 9.60% | 13.99% | 17.78% | 13.49% |
| Toll rate | 4.65% | 3.85% | 4.48% | 4.71% | 4.58% | 3.81% | 4.25% | 4.95% | 4.68% |
| Sales rate | 1.85% | 1.50% | 1.93% | 2.06% | 1.92% | 1.50% | 2.02% | 2.01% | 1.98% |
| Variable contribution | 7.30% | 4.37% | 7.63% | 10.75% | 7.41% | 4.29% | 7.72% | 10.82% | 6.83% |
| Change YoY, bp | −11 | +8 | −9 | −7 | +58 |
The lead indicator for the first test is this change against a year earlier: −11 bp in Q2’26. The trailing rate moves later. Q3 carries the highest variable contribution, so Q3’26 replacing Q3’25 can lift the trailing rate even if Q3 itself weakens. H
How travelers reach Booking
- Direct: mid 60s %. Zero marginal acquisition cost. Higher if B2B is taken out of the denominator: B2B customers belong to the partner, so they can never be direct. Probably growing fast.
- SEO: organic, unpaid search. Booking’s former moat, and it was extraordinary at it: it captured a large share of travel queries for free for two decades. Current state: “decline in traffic”, the “SEO channel a small component of our overall room nights”. Forecast: a “decline in short to medium term, which may lead to increase spend in paid marketing channels”.
- Paid channels: buying the click. Google’s ad auction, affiliate programs, referrals, social media, brand marketing, search engine keyword purchases. Booked as “marketing expenses”.
- B2B. An estimated 196 million room nights TTM (Expedia discloses about 170 million), 15% of the total. Watch whether Booking starts to disclose it; at Expedia, B2B revenue grows 23%, against 8% for its consumer business. This segment is demand acquired without touching Google.
The CFO: two-thirds of traffic comes to Booking directly, and it pays for one-third. Booking facilitates payments on low-70s % of transactions. ii
| Direct and app | Q2’26 | Q1’26 | Q4’25 | Q3’25 | Q2’25 | Q1’25 |
|---|---|---|---|---|---|---|
| B2C direct mix, share of B2C | mid 60s | mid 60s | mid 60s | |||
| Room nights booked on the app, TTM share | high 50s | high 50s | mid 50s | mid 50s | mid 50s | mid 50s |
The B2C direct mix was in the low 60s in Q2’24; it is in the mid 60s now, stable year on year as a share. The app share is a defense against the agentic AI threat. A different consumer pattern: shorter stays, lower accommodation ADR. To keep the share stable while growing, the absolute number of direct bookings is also growing at the same rate.
B2B, the anonymous supply API
In B2B, Booking sells volume as an anonymous supply API. It is similar to the AI bear case, and Booking is already being paid for that kind of service. The unit starts formally in January ’27. The doubt is how much: what is the B2B take rate?
Booking is consolidating the Booking.com, Agoda and Priceline teams into a single B2B unit, eliminating duplication and internal competition for the same customer. B2B partners named unofficially: Citi Travel, Apple, Microsoft, American Airlines, Southwest, Lufthansa, Air France-KLM, Emirates. iii B2B has a “great future”, in the CEO’s words.
Expedia’s B2B margin is 240 bp above its consumer take rate of roughly 10–13%, and also growing at double digits. If Booking’s B2B is built on Agoda’s B2B technology, as it seems, Agoda is a net-rate merchant: it buys inventory at a net rate and sells to the partner at a marked-up rate, so the economics are similar to Expedia’s. Against that, the CFO’s comment: “B2C unit economics are much higher.” With Agoda, Priceline and Booking together, partners may lose negotiating leverage once the three brands stop bidding against each other, which lifts the B2B take rate.
B2B sits outside the Google auction, at higher margins and high growth, but with no direct traffic: a layer invisible to the end customer. The CEO, paraphrased: not so much proprietary data as live, accurate, immediate data, which is what the partner wants; more about the relationship with the partner, to boost sales. The secret sauce is the relationship.
Alternative accommodation and the moat
The attack on Airbnb’s pie.
| Alternative accommodation (AA) | Q2’26 | Q1’26 | Q4’25 | Q3’25 | Q2’25 | Q1’25 |
|---|---|---|---|---|---|---|
| AA share of room nights | 37% | 38% | 36% | 36% | 37% | 37% |
| AA listings growth, YoY | 8% | 9% | 8% | 10% | 8% | 9% |
| Global room nights growth | 5.2% | 6% | 9.2% | 8% | 7.7% | 7.4% |
| AA room nights growth | 4% | 5.5% | 9% | 10% | 10% | 12% |
| Global average daily rate (ADR), YoY | 2% | 1% | 1% | 1% | −1% | 1% |
An accelerating trend, broken by the Iran war. ADR: Europe pushing up, Asia pushing down.
Why is AA growing below global room nights? The numerator is Booking.com; the denominator is Booking.com plus Agoda plus Priceline. So no AA weakness is needed for AA to grow less. The Q2 explanation is faster growth at Agoda and Priceline: the US was the fastest region in Q1 and Q2.
AA listings are growing faster than AA room nights: demand is not catching up. In Q2’26 AA room nights rose 4% year on year, below the overall 5.2%, affected by events in the Middle East and low penetration in the US.
Geography and supply
Alternative accommodation is very strong in Europe, less so in Asia, where the culture focuses on hotels, and relatively smallest in the US: an opportunity to grow there. More supply, with listings up 8% year on year, is an indicator of future growth.
Regional room nights are based on the traveler’s region: “increased demand in Europe” means Europeans booking anywhere in the world.
The moat
8.6 million listings require aggregation, maintenance and regulatory compliance to be the merchant of record: much more complex than loading a database. A strong value proposition on the supply side (discoverability, reliability) and on the traveler side too. ii
The 36% AA share of Booking’s room nights is more than three-quarters of Airbnb’s total room nights. H Still, 90% comes from alternative accommodation, independent hotels and small chains, still very fragmented, and only 10% from big chains. That matters for the loyalty program.
Demand, regions and resilience
“General travel” is one of the most resilient categories in consumer discretionary. ii When there is a geopolitical disaster, the first reaction is to cancel and wait; after the shock, demand comes back. Travelers were careful from March to May, but from June demand picked up strongly.
The indirect impact runs through jet fuel and airline ticket prices, and that is more of a change in behavior: far less long-distance travel and more domestic travel, more so in the EU and Asia.
The change in Q2: the US is the strongest travel market, when a couple of years ago it was the weakest of the largest. The CFO in Q2: “focus on US growth”. Travel is still 70% online, 30% offline.
AI and competition
Booking’s AI experiments run from booking upward; Expedia’s run from planning downward. Booking starts where it has a conversion baseline.
- Inspiration
- Planning
- Shopping and comparison
- Booking
- In-trip
- Post-trip
Inspiration and planning feed into comparison and shopping. The top of the funnel is expensive in inference and hard to monetize: long conversations with people who may never book. Bottom-of-funnel AI attaches every dollar of inference cost to a transaction that is clearly converting.
Expedia is retreating from end-to-end. Expedia’s Romie is end-to-end, from inspiration to booking to support, which creates a huge liability surface if it is wrong. Expedia is abandoning it for specialized multi-agents, each calling a deterministic API rather than generating facts from an LLM, sitting at the front of the funnel. Expedia abandoning end-to-end undercuts the bear thesis of AI taking the whole funnel.
Lola and the West Coast venture are managed as greenfield investments outside Booking: the innovator’s dilemma framework, and Priceline’s 2005 strategy with Booking.com as a start-up.
What is actually arriving. The CFO: LLM traffic to Booking is very small, under 1% of traffic, paid and unpaid. People do their research elsewhere, as always. ii There are five customer-facing AI tools, two of them start-ups. Two start at the planning phase, top of the funnel down, like Penny. One is Booking.com, bottom up, as the website is so optimized that they don’t want to disturb customer conversion.
Booking’s target with AI: frictionless travel planning. You give a set of complex requirements, and it offers solutions based on your preferences and previous history. Penny already does something like that, on a very small sample.
The CEO’s ambition for AI: predict problems before they happen (a flight delay, for example) and fix them automatically or propose alternatives, even before the customer notices. Say you bought a museum visit and a boat trip through Booking.com: AI can see the weather two days ahead and make changes, the museum on the rainy day and the boat on the sunny one. Suggestions based on your booking history: going to lakes, to see castles. That data is the moat.
The CEO: “Trying to use AI to predict problems before they happen.” “Worry about the token cost.” “There is no such thing as a moat.” “There is no such thing as being protected against innovation.” “Every day we have to fight it.”
Instant Checkout. ChatGPT’s Instant Checkout launched in September ’25 and closed in February ’26: it failed. People research in the assistant and book where they trust. ChatGPT then launched CPC, a mirror of Google’s relevance-weighted auction. ChatGPT tried being Expedia and ended up as Google. iii
Margins, seasonality and cash flow
The EBITDA margin, including SBC, is 1.7× that of peers such as Expedia and Airbnb: more than 70% higher than the largest peers. A balance between growth, investment and margins. H
| Operating margin | Q2’26 | Q1’26 | Q4’25 | Q3’25 | Q2’25 | Q1’25 |
|---|---|---|---|---|---|---|
| Operating income / revenue | 34% | 23% | 32% | 38.7% | 33.1% | 22.3% |
Seasonality. Revenue is recognized at check-in, and accommodation in Europe and North America peaks in the Q3 summer and is lower in Q1. Marketing expenses and the associated revenue are recorded at different times, so Q3 profitability is up and Q1 profitability down. The length of the booking window matters too: gross bookings are recognized when the booking is made, and revenue at check-in. The 2025 booking window was shorter than 2024’s.
| Ratios | FY’25 | FY’24 | Q2’26 | Q1’26 | Q4’25 | Q3’25 | Q2’25 | Q1’25 |
|---|---|---|---|---|---|---|---|---|
| Marketing efficiency: marketing expense / gross bookings | 4.4% | 4.4% | 4.65% | 3.84% | 4.49% | 4.71% | 4.58% | 3.81% |
| Competitor and merchandising pressure: revenue / gross bookings | 14.5% | 14.3% | 14.4% | 10.3% | 14.8% | 18.1% | 14.6% | 10.2% |
| Opex growth, YoY | FY’25 | FY’24 | Q2’26 | Q1’26 | Q4’25 | Q3’25 | Q2’25 | Q1’25 |
|---|---|---|---|---|---|---|---|---|
| Marketing | 12.5% | 7.5% | 10.8% | 16.4% | 22.3% | 8.8% | 10.3% | 10.4% |
| Sales and other | 10.7% | 13.7% | 4.8% | 14.5% | 10.7% | 17.2% | 9.6% | 3.5% |
| Personnel, incl. SBC | 1.5% | 1.8% | 0.4% | 28.9% | 1.9% | 8.9% | 11% | −16.1% |
The remaining lines (G&A, IT, D&A, impairment, transformation costs) are the tail. Opex is dominated by three categories: marketing, 45% of total opex; sales, 19%; and personnel, 19%. Together they are 83% of opex. The transformation program’s additional savings were raised from $550m to $650m, mainly in procurement. ii
| Cash flow, $m | Q2’26 | Q1’26 | Q4’25 | Q3’25 | Q2’25 | Q1’25 |
|---|---|---|---|---|---|---|
| CFO ex SBC, ex deferred merchant revenue | 1,199 | 1,247 | 7,996 | 3,701 | 1,154 | 1,237 |
| Adjusted CFO / revenue | 16.3% | 22.5% | 126% | 41.1% | 17% | 26% |
Marketing is expensed at booking, while revenue is recognized at check-in, so H1 is cash-consumptive and H2 cash-generative. A slight decline year on year in the cash-consumptive quarters.
Capital: the buyback, impairments and management
A huge cash position: 58% of total assets. Cash minus long-term debt is roughly zero, so technically a non-levered company. Not quite, though: a lot of that cash comes from deferred merchant bookings. More accurate: $18.2b of long-term debt against $29.7b of total assets, 61%. H Total equity is negative, and increasingly so: from +2,782 in FY’22 to −10,783 in Q2’26. i
| Shares outstanding | Q2’26 | ’25 | ’24 | ’23 | ’22 |
|---|---|---|---|---|---|
| Millions | 770 | 816 | 852 | 913 | 1,001 |
| Change | −5.6% | −4.2% | −6.7% | −8.8% | — |
An aggressive buyback. Fantastic: a company with more than 60% market share, with antitrust concerns on every move it makes, returns its cash flow to shareholders, a cash cow. In H1 2026, $7.4b of buybacks at $173 a share. i
Impairments. In FY’20, OpenTable and Kayak goodwill was impaired by $1.0b. They were 2014 and 2013 purchases, $4.4b in total, so the impairment was about 23% of the value, seven years later. In Q3’25, an additional Kayak impairment of $457m: in total, about 33% of the value. H
| Insider holdings | From | To | By shares | By dollar value |
|---|---|---|---|---|
| CFO Steenbergen, ’24 to Sep ’26 | 83,425 | 59,794 | −28% | −18% |
| CEO Fogel, Sep 2022 to 2026 | 1,184,105 | 643,674 | ≈ −45% | $88.8m → $109.4m, +23% |
The CEO is not talking about improving margins going forward, but about pursuing opportunities.
What I watch
- B2B from January ’27: whether Booking discloses it, and the take rate.
- Advertising revenue: the line most at risk from AI agents that navigate rather than search.
- The transformation-cost add-back: at what point is a recurring cost an operating cost?
- App and direct mix, the defense against agentic AI.
- Alternative accommodation listings growth against room nights growth: demand is not catching up.
- The CFO’s claim that “general travel” is one of the most resilient categories in consumer discretionary, audited with CoStar STR weekly data for the US (RevPAR, ADR, occupancy), BEA monthly data for the US (PCE services detail: accommodation and transportation services) and Eurostat monthly data for Europe.
- Variable contribution, each quarter against the same quarter a year earlier: the lead indicator for the first test (−11 bp in Q2’26).
- The three tests that would put the thesis under review (step 3).
Position on the day of publication: held. I don’t trade against a published view in the 72 hours after publishing it, except to carry out a pre-stated exit or risk limit. Not investment advice.